Four Ways to Build Custom Reports in Microsoft Dynamics 365
All your collected data is useless if you can’t find what you need when you need it. The right reporting will keep your data organized. Below are four ways to view the data you have in your Microsoft Dynamics 365 system. Let’s compare your options:

1. Report Builder
Any user can build reports in Dynamics 365 with the Report Builder Wizard. The Wizard makes it easy to identify which fields you want to use, in which order, and how you want them sorted, etc. You can format your results with colors and fonts and save them to PDF, Word, Excel, PowerPoint, etc. Also, you would need a programmer to achieve a high level of customization.
2. Dashboards
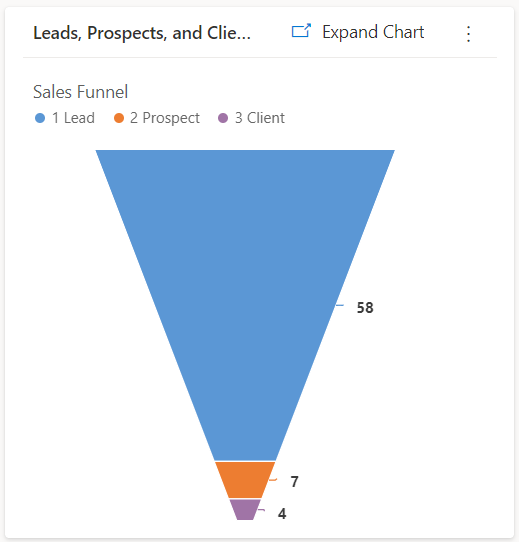
Dashboards provide a single “pane of glass” so users can see multiple views and charts, including pie charts, funnel charts, bar charts, and all the other charts, similar to Microsoft Excel. Dashboards are customizable per person or job role depending on priorities or preferences, e.g., current or planned activities or goals. If a user is comfortable using Microsoft Excel, setting up dashboards in Dynamics 365 will be easy.
3. Advanced Find
Use Advanced Find to build search lists called “views.” A view is a grid of information with moveable columns and rows. They can be quite complex, depending on the queries you want to build. Dynamics 365 allows for public views or personal views. Export these views into Microsoft Excel as a static file that doesn’t change or a dynamic file that lets you update your CRM data from within Excel. Power users of Microsoft Dynamics 365 can create these more complex views.
All of the options above – Report Builder, Dashboards, and Advanced Find – allow drilling down on the data to get to the actual record.
4. Power BI
Power BI allows you to report on anything. Pull data from your accounting system, your production system, etc. and morph it into a friendly dashboard. Set it up exactly the way you want it. Power BI dashboards can be saved directly in your Dynamics 365 CRM for quick access. You can also set up filters, and every time you change a filter, all of your data will automatically update. With Power BI for reporting, you can’t easily drill down and get right to the CRM record. It is great for analyzing data but not as good for editing data. Power users with a technical background can learn to use Power BI but with some effort.
Is there an additional licensing cost?
Report Builder, Dashboards, and Advanced Finds are all included in the cost of Microsoft Dynamics 365. Power BI is an additional $10/month for the creator of Power BI reports or dashboards. Those are the four main methods for building reports in Microsoft Dynamics 365. You can save money by building them yourself, or you could save a lot of time by paying your Microsoft Dynamics Partner to build them for you. If you’d like assistance, contact our Business Intelligence experts today.


